LLM Monitoring in Production (the Layer Tracing and Evals Don't Cover)
LLM monitoring watches aggregated signals over time to catch drift, cost creep, and regressions before users do. Set thresholds that fire and close the loop.
LLM monitoring watches aggregated signals from an AI application over time to catch problems across requests before your users do. It tracks latency, cost, error rate, output quality, and drift, the kind of trouble that shows up only in aggregate and never in a single request. It is the third leg of observability, distinct from tracing and evaluation, and it is the one most guides fold into a generic metrics checklist and a tool table.
Classic model monitoring watched accuracy and data drift for a model you trained; LLM monitoring extends that idea to cost, tool use, and output quality for a system you did not train and cannot fully predict. This page covers what monitoring is for that the other two layers are not, what to actually watch, how to set thresholds that fire without drowning you in noise, which AI observability tools fit where, and how to close the loop from an alert to a fix.
How Is LLM Monitoring Different from Tracing and Evals?
Monitoring, tracing, and evaluation get lumped together as “observability,” but they answer three different questions, and confusing them is why teams instrument all three and still get surprised in production.
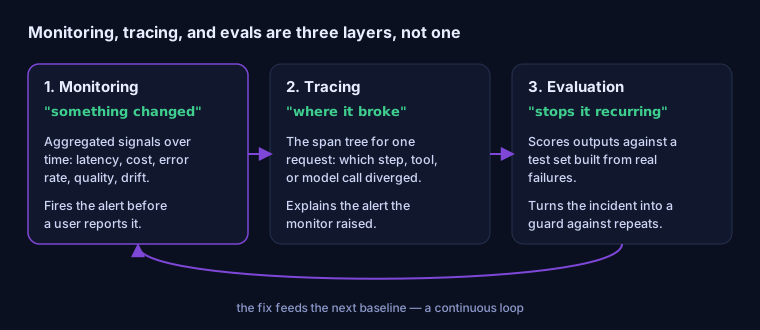
LLM tracing records one request as a tree of spans, so it tells you exactly where a single run broke. Evaluation scores outputs against a test set, so it tells you whether a change is good before you ship it. Monitoring sits between them in time: it watches many requests in aggregate and tells you that something changed, a gradual quality slide, a cost creep, a regression after a model upgrade, patterns no single trace reveals because each individual request looked fine.
The order matters in production. Monitoring fires the alert. Tracing explains it. Evaluation stops it from recurring. A team that has tracing but no monitoring can debug any failure a user reports, but has no way to catch the slow regression no user has reported yet. The practitioners in Mutagent’s corpus name this exact gap:
“Notebook evals lie. Things look fine in a demo and slowly rot in prod. We watch retry rates, time to complete, and silent failures over time.” — r/AI_Agents
What Should You Actually Monitor?
Every monitoring guide lists the same signals. The useful question is not what you can track but how fast each signal needs a human, because that determines whether it pages someone, sits on a dashboard, or triggers an investigation. Three tiers:
| Tier | Signals | What it does |
|---|---|---|
| Immediate action | p99 latency, error rate, cost per request anomalies | Pages on call; an infra or provider problem in progress |
| Trend | Hallucination rate, task-completion rate, output-length distribution | Lives on a dashboard reviewed daily or weekly; catches slow quality slides |
| Drift | Prompt-embedding distribution shift, output semantic drift, concept drift | Needs statistical detection; triggers investigation, not a page |
When you are monitoring AI agents in production, cost belongs in tier one, for a reason the corpus makes vivid: agents fail in ways that are quiet but expensive.
“A regression after updating my prompt, no idea when it broke. $80 in API costs on a task I thought would cost $8.” — r/AI_Agents
Map each signal to the OpenTelemetry GenAI semantic conventions attribute that carries it (gen_ai.usage.input_tokens, gen_ai.request.model, and the rest) so your monitoring stays portable across tools instead of locked to one vendor’s schema.
How Do You Set Alert Thresholds That Actually Fire?
This is the part almost no guide covers with anything concrete, and it is where most monitoring setups fail in practice: they alert on raw static thresholds, which either miss slow regressions or page so often that everyone mutes them.
Four rules make thresholds useful:
- Burn rate over raw threshold. “Error rate above 1%” is the wrong trigger. Alert on how fast you are burning an error budget against a baseline, so a slow doubling fires before it crosses an arbitrary line and a brief blip does not.
- Earn your baseline. A threshold is only as stable as the window it is measured over. Below a few hundred requests a day, percentile metrics like p99 are noise; aggregate over a longer window or fall back to simpler counts for low-traffic systems.
- Correlate, do not stack. A latency spike, a rising error rate, and higher cost per request arriving together are one incident, not three pages. Group correlated signals into a single alert with a single root cause.
- Version your alert configs. A threshold is a decision. Keep it next to your prompt versions so a change in what you alert on is as traceable as a change in the prompt itself.
What Does It Cost to Monitor an LLM in Production?
Capturing signals is cheap. Scoring quality is not, and that is the trap. Running an LLM-as-judge over every production response to measure hallucination or faithfulness can, depending on the model and how often you score, approach the cost of the inference you are serving, so teams set it up, see the bill, and quietly switch it off. That leaves them blind to exactly the quality regressions monitoring exists to catch.
The resolution is to tier your evaluation spend rather than run it on everything:
- Score 100% of error and exception traces. They are rare and high-value.
- Run a cheap deterministic or heuristic filter (schema checks, length bounds, refusal detection) to flag likely near-misses for free.
- Take a 5 to 10 percent sample of the remaining successful traffic for the expensive LLM-as-judge.
That keeps quality monitoring within a few percent of inference cost instead of doubling it, and a 10 percent sample plus every failure is enough signal to catch a regression without your monitoring bill scaling one to one with traffic. This is the eval-scoring analogue of the trace-sampling strategy on the LLM tracing page: sample with intent, keep every failure.
How Do You Detect LLM Drift Before It Becomes a Regression?
Drift is the signal that separates monitoring from a status dashboard, and it comes in two kinds that need different responses. Data drift is a shift in the inputs: users start asking new things, a new format or locale appears. Concept drift is a shift in what a right answer is while the inputs look unchanged, usually because a policy or product detail moved underneath the model.
Detect both in two passes. First a statistical layer on embeddings: AWS’s prescriptive guidance recommends Wasserstein distance over the Kolmogorov-Smirnov test for high-dimensional embedding spaces. The trigger should be relative, not absolute: alert when the distance between the current window and the baseline exceeds its own recent variance by a set multiple, so a normal week stays quiet but a real shift fires. Then, only when the statistical layer fires, a sampled LLM-as-judge classifies which drift it is and whether it matters. Running the judge only on flagged samples is what keeps drift detection inside the cost budget above.
The reason to catch drift early is that it is a regression in slow motion. Caught at the statistical stage it is a prompt or retrieval adjustment; caught when users complain it is an incident.
From Alert to Root Cause: Closing the Loop
A monitoring alert is the start of the work, not the end. The model that makes monitoring pay off runs as a loop: monitor detects the change, tracing locates it, evaluation prevents its return.
When an alert fires, triage by type before you dig. Each kind of alert routes to a different first move:
| Alert type | Likely cause | First diagnosis step |
|---|---|---|
| Latency spike | Infrastructure or the model provider | Check provider status and p99 by model; compare to the last deploy |
| Cost anomaly | Input length exploded somewhere | Find the step whose token count grew; look for a retry loop or a verbose tool output |
| Quality drop | The prompt, the model, or the data | Pull traces from the affected segment and compare to the last known good version |
Each path ends in the trace, where you confirm which step changed. Pinning your prompt, model, and retrieval config to versions lets you compare against the last known good and narrow the change that caused the regression. Then, before you fix forward, run the change through eval-driven prompt optimization so you are not trading one regression for another.
The corpus shows teams reaching for exactly this loop, building it by hand off their traces:
“The goal is to implement a system that can answer these for agents from their OTel traces: measure satisfaction over time, track average cost of conversations, find outliers.” — r/Observability
Cost that moves without warning, regressions nobody can date, and failures that stay silent until someone goes looking are among the most common production complaints across Mutagent’s community-research corpus of 7,797 developer pain quotes.



Next Steps: Monitoring as the Front of the Loop
Monitoring is what fires first. It catches the change that tracing then explains and evaluation then guards against. Set it up as tiered signals with burn-rate thresholds and sampled scoring, and it becomes an early-warning system instead of a dashboard nobody checks.
Mutagent’s autonomous AI Engineer runs this loop continuously across your agent’s lifecycle. Its Monitor step watches the signals above, its Diagnose step starts from the trace at the root of a regression, and its Optimize step proposes and validates the fix before it reaches your users. Meet the autonomous AI Engineer to see the full Monitor, Diagnose, Optimize loop at work.
Frequently Asked Questions
What is the difference between LLM monitoring and LLM tracing?
Tracing records one request as a tree of spans, so it answers where a single failure happened. Monitoring watches signals aggregated over many requests across time, so it answers whether something has started going wrong at all. A trace shows you the broken step in one run; monitoring shows you that the error rate has been climbing for an hour, that cost per request doubled after a deploy, or that output length is drifting. In practice monitoring fires the alert, and you then open the trace to explain it. You need both, plus evaluation to keep the regression from coming back.
What metrics should you monitor for an LLM in production?
Group them by how fast they need action, not by what is easy to collect. Immediate-action signals page you: p99 latency, error rate crossing a threshold, and cost-per-request anomalies. Trend signals go on a dashboard reviewed daily or weekly: hallucination or task-completion rate week over week, and output-length distribution. Drift signals need statistical detection and trigger an investigation rather than a page: prompt-embedding distribution shift and output semantic drift. Map each to the OpenTelemetry GenAI attribute that carries it, such as gen_ai.usage.input_tokens for cost, so your monitoring stays portable across tools instead of locked to one vendor. Skip vanity metrics like raw request volume that never change a decision.
How do you set alert thresholds for an LLM application?
Avoid raw static thresholds like error rate above one percent, which either miss slow regressions or page constantly. Prefer SLO burn-rate alerting against a baseline measured over a stable window, and require a minimum traffic volume before percentile metrics mean anything, since p99 is noise below a few hundred requests a day. Correlate signals instead of alerting on each: a latency spike plus rising error rate plus higher cost per request is one incident, not three pages. Version your alert configs alongside your prompts so a threshold change is traceable.
What does it cost to monitor an LLM in production?
Capturing signals is cheap; the expensive part is quality scoring. Running an LLM-as-judge over every production response can cost as much as the product inference itself, which is why teams quietly turn evaluation off. Tier it instead: score 100% of errors, run a cheap heuristic filter to catch likely near-misses, and take a 5 to 10 percent sample of the rest for the expensive judge. That keeps quality monitoring within a few percent of inference cost while still catching regressions, so your monitoring bill does not scale one to one with traffic.
What is the difference between data drift and concept drift in LLMs?
Data drift is a change in the inputs: users start asking different questions, or a new locale or format appears, so the prompt distribution shifts. Concept drift is a change in what a correct answer is while the inputs look the same, often because a policy, product, or user intent changed underneath you. They need different responses. Data drift usually calls for new evaluation cases and sometimes retrieval updates; concept drift calls for revisiting the prompt or the ground truth. Detect both with a statistical test on embeddings, then use a sampled LLM-as-judge to classify which one fired.