What Is LLM Tracing (and Why Your Tracing Tool Might Be Lying to You)
LLM tracing records every step an AI agent takes so you can debug failures. Learn what to trace, the silent-drop problem, and how to keep signal reliable.
LLM tracing records every step an AI agent takes inside a single request: each model call, tool invocation, retrieval lookup, and hand-off between agents, captured as a tree of timed spans with the inputs, outputs, and token counts attached. That structure is what lets you replay a failure, attribute cost to the exact step that caused it, and catch non-deterministic errors before your users do. The catch nobody mentions: the trace only helps if the data actually arrives.
This page covers what to instrument, how to read a trace, and the gap every other guide skips: the observability tool that quietly stops collecting your data while your app keeps running.
Why Are Logs Not Enough for Agent Debugging?
Logs answer “what happened.” LLM tracing answers “why, and at which step.” For an AI agent, only the second question is useful.
A REST endpoint does one predictable thing, so a log line and a stack trace are enough. An agent does not. It chooses tools at runtime, branches on model output, loops, and delegates to other agents. When it fails, the log is usually a generic error far downstream from the real cause, with no way to compare one run against another. Mutagent’s community-research corpus catalogs this as the field’s most-repeated complaint: across the agent-behavior-opacity cluster, the recurring refrain is that debugging agents is harder than building them.
The reason is structural. Logs are flat; agent execution is a tree. One request produces a root span for the task, a child span per tool call, a grandchild span per model call inside that tool, and sibling spans for parallel steps. A log file cannot represent that hierarchy. A trace is that hierarchy.
| Property | Application logs | LLM traces |
|---|---|---|
| Structure | Flat lines | Nested spans, parent and child |
| Causation | You infer it | Encoded in the span tree |
| Timing | Timestamp per line | Duration per span, total latency visible |
| Token cost | Not captured | Per-span tokens and cost attribution |
| Replay | Not possible | Inputs and outputs per span, replayable |
| Non-determinism | Hidden | Surfaced: same input, different output across runs |
| Multi-agent | Cannot correlate | One trace ID shared across agents |
For a deterministic system, logs are fine. For an agent that routes, loops, and delegates, the trace is the only artifact that makes a failure legible.
What Should You Actually Trace? Four Span Types
Setting up llm tracing is the easy part. Deciding what to instrument is where teams under- or over-shoot. Capture these four span types and skip almost everything else.
| Span type | Record | Why it matters |
|---|---|---|
| LLM call | Model, prompt (or hash), completion, input/output tokens, latency, temperature | Root of most bugs and nearly all cost; required for any cost attribution |
| Tool call | Tool name, arguments, output, success or failure, latency | Tools lie. A call can return HTTP 200 with an error payload and the agent proceeds on bad data |
| Retrieval | Query, retrieved chunks with scores, index, latency | Retrieval quality drives output quality, and it is invisible without a span |
| Agent step | Which agent ran, which tools it picked, what it decided | The only way to debug delegation in a multi-agent system |
Here is one request from a support agent that looks up an account, calls a billing API, then drafts a reply:
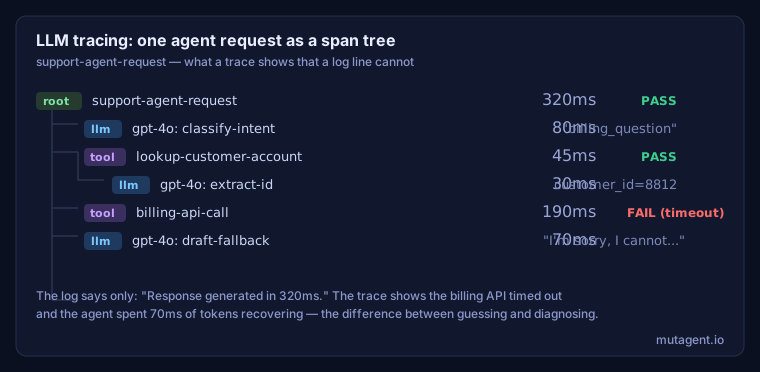
[root] support-agent-request        320ms   PASS
  [llm]  gpt-4o: classify-intent      80ms   "billing_question"
  [tool] lookup-customer-account      45ms   PASS
    [llm] gpt-4o: extract-id          30ms   customer_id=8812
  [tool] billing-api-call            190ms   FAIL (timeout)
  [llm]  gpt-4o: draft-fallback       70ms   "I'm sorry, I cannot..."
Without the tree, the log is one line: Response generated in 320ms. With it, you can see the billing API timed out, the agent recovered with a fallback, and that recovery cost 70ms of tokens you could reclaim by fixing the upstream API. That is the difference between guessing and diagnosing. Do not trace every variable and string operation; instrument the boundaries and keep the signal-to-noise ratio high.
Does Your Tracing Tool Actually Receive the Data?
Here is the gap every llm tracing guide skips: the observability tool itself can silently lose your data, and it will not tell you.
This is not hypothetical. Mutagent’s analysis of Langfuse GitHub issues found that the single largest complaint cluster, at 31% of the quotes, is SDK tracing reliability: traces that vanish with no error, no log, and no warning.
“Langfuse requires Redis to use noeviction for its queue; with volatile-lru, Redis can silently evict jobs from the queue, causing traces to be dropped without errors or logs, even at debug level.” — GitHub, Langfuse issue #10202, November 2025
A separate failure mode is the flush path hanging on shutdown:
“When flush() is called, it executes self.mediauploadqueue.join()… flush() can hang indefinitely if those threads are no longer alive to call taskdone(), leading to function timeouts.” — GitHub, Langfuse issue #11104, December 2025
This is not one vendor’s bug. In Mutagent’s analysis of LangSmith issues, 34% of the quotes describe the SaaS-side version of the same failure:
“At some point it stops posting traces to the LangSmith API, while the application keeps running ok and there is no log stating that something went wrong.” — GitHub, langsmith-sdk issue #1630, June 2025
The pattern is consistent: the application looks healthy, the tracing SDK fails quietly, and you discover the gap hours later when you go looking for a trace that was never recorded. The observability tool has no observability into its own pipeline.
What this means in practice: before you trust any trace data, prove the pipeline works. Send a test request, confirm the trace appears end to end, and add a health check on the flush and ingestion path. “No error” does not mean “data arrived.”
How Do You Trace Agents Built Without a Framework?
The second gap in llm tracing tooling is framework lock-in. Most tools are built around LangChain or LlamaIndex and treat everything else as a second-class integration, which is a problem because most production agents are not pure-framework code.
Mutagent’s analysis of Opik issues surfaces the custom-agent case directly:
“We have a custom agent implementation (no orchestration frameworks) and are manually adding the decorator to functions where our LLM invocations are… the built-in Gemini integration doesn’t provide enough flexibility to group traces together in a single session.” — GitHub, Opik issue #1990, December 2025
And the cross-boundary version, where a single trace has to survive process and service hops:
“There’s a significant challenge in maintaining and extending a single distributed trace across various execution boundaries.” — GitHub, Opik issue #2513, February 2026
Framework-agnostic tracing means any LLM call, from any provider, in any execution pattern, produces a span. That requires instrumenting at the API-call level, or with explicit manual spans, rather than relying on a framework’s context manager being in scope. For multi-agent systems it also requires propagating a shared trace ID across boundaries yourself. If you build custom agents, the practical test of a tool is simple: can you attach a trace ID to an outbound request and pick it up on the other side without a framework holding your hand?
The open standard for this is OpenTelemetry, with the W3C Trace Context spec defining how a trace ID rides across services in a traceparent header. Instrumenting at that layer keeps your traces portable across tools instead of locked to one vendor’s SDK, and a manual span looks the same whether or not a framework is in play:
from opentelemetry import trace

tracer = trace.get_tracer("agent")

with tracer.start_as_current_span("llm-call") as span:
    span.set_attribute("gen_ai.request.model", "gpt-4o")
    span.set_attribute("gen_ai.usage.input_tokens", n_in)
    response = client.chat.completions.create(...)
    span.set_attribute(
        "gen_ai.usage.output_tokens",
        response.usage.completion_tokens,
    )
The same pattern wraps a tool call or a retrieval step. Open a span at the boundary, attach the attributes that matter, and the span tree assembles itself.
Why Do Teams End Up Tracing Nothing? The Cost Paradox
Many teams set up llm tracing, discover the evaluation bill is unsustainable, and quietly switch it off.
“We needed observability for our LLM app but evaluating every production request would cost more than the actual inference.” — r/mlops, surfaced in Mutagent’s community-research corpus
That is the monitoring cost paradox: LLM calls are both the most important thing to instrument and the most expensive to re-evaluate, because running an LLM-as-judge over every production trace can double your inference cost. The resolution is sampling with intent. Based on the patterns across Mutagent’s corpus, a workable default:
- Trace every request, exporting spans asynchronously so capture overhead typically stays in single-digit milliseconds.
- Keep 100% of error traces and 10-20% of successful ones.
- Run model-based evaluation offline against the sample, never inline with the request.
- Attribute cost to every span so you can find the expensive step without re-running it.
A 10% success sample plus every failure gives enough signal to catch regressions without your monitoring bill scaling with traffic.
How Do You Turn Tracing Into an Improvement Loop?
The common mental model is “set up tracing, glance at the dashboard when something breaks.” That produces the deploy-and-pray workflow Mutagent’s research repeatedly documents in the production-blindness cluster: engineers who know they are flying blind but have no structured alternative.
A better model runs continuously as Monitor, Diagnose, Optimize:
- Monitor. Baseline token cost, latency, and error rate, and set a regression threshold (error rate doubles, p95 latency up 30%). Traces feed the baseline automatically once instrumentation is in place.
- Diagnose. When a metric crosses the line, start from the trace. Which span changed, which tool failed, which decision path was new? The answer is in the span tree, not the logs.
- Optimize. Make the targeted fix, a prompt edit, a tool repair, a model swap, and validate it against the trace sample before deploying.
This loop is the line between reactive debugging, where a user reports a problem and you go digging, and proactive observability, where the system flags the change before anyone notices. Tracing is what makes the loop possible. Without it you are back to logs and guesswork.


Next Steps: Wiring Tracing Into an Improvement Loop
LLM tracing is the foundation of agent observability, but only if the signal is reliable. Once you have a trustworthy trace pipeline, the next step is wiring it into a structured improvement loop: Monitor what changed, Diagnose why, Optimize the step that regressed.
Mutagent’s autonomous AI Engineer runs that loop continuously across your agent’s lifecycle. Its Diagnose step starts from your traces and surfaces the span, tool, or prompt at the root of a regression, without you paging through a trace viewer by hand. Meet the autonomous AI Engineer to see the full Monitor, Diagnose, Optimize loop in action.
Frequently Asked Questions
What is the difference between LLM tracing and logging?
Logging records individual events as flat lines. LLM tracing records a structured tree of spans, each capturing the input, output, latency, and token count of one step in an agent's execution. The hierarchy is what shows causation: which step triggered which, and where time and cost actually went. For non-deterministic agents, logs give you events; traces give you explanations.
How do you trace a multi-step agent pipeline?
Give each agent step its own span, nested under one root span for the request, and propagate a shared trace ID from the entry point through every sub-agent, tool, and model call. Most SDKs handle this inside a single process automatically. Across service boundaries, when one agent calls another over HTTP, pass the trace context in a header and resume it on the receiving side.
Can you trace agents that don't use a framework like LangChain?
Yes, but support varies sharply. Custom agents need a tool that instruments at the API-call level rather than through framework hooks, because framework-native tools give degraded or empty results for non-framework code. Look for a tool that lets you open and close spans manually and propagate trace context without a framework-specific decorator.
Why do tracing tools sometimes stop collecting traces?
Two common modes. First, SDK flush failures, where the background thread or async queue that ships data crashes or hangs while the app runs on with no error; Mutagent's analysis found this in about 31% of the Langfuse quotes, the single largest cluster. Second, infrastructure misconfiguration, such as a Redis eviction policy set to volatile-lru instead of the required noeviction, which silently sheds queued traces. In both cases the app looks healthy and no data arrives, so validate the pipeline end to end before relying on it.
What does LLM tracing cost to run in production?
Instrumentation overhead is low: span creation and async export add single-digit milliseconds to a request that already takes hundreds. The expensive part is model-based evaluation of traces, which you should run offline against a sample rather than inline. A reasonable starting point is to retain all traces for 7 days, sample to 10-20% for longer storage, and run evaluation jobs nightly.